Monday, May 11, 2015

Bellarmine Ecology Project

COMMON/SCIENTIFIC NAME

Producer


Ginkgo Tree / Ginkgo Biloba

Lives in temperate and Mediterranean Climates.


Primary Consumer


Garden Snail / Cornu aspersum

Lives in dark dank places in grassy temperate biomes.


Secondary Consumer


False Black Widow / Tegenaria Domestica 

Dark and dank places in grassy temperate biomes.


Tertiary Consumer


Domestic Pigeon / Columbia livia Domestica

Almost globally in temperate biomes.


Decomposer


Garden Snail / Cornu aspersum

Lives in dark dank places in grassy temperate biomes.


Herbivore

N/a

Carnivore


Dog / Canis Lupus Familiaris 

Lives almost globally in temperate mediterranean biomes


Omnivore


Modern Human / Homo Sapian 

Everywhere


Threatened species

N/a

Endangered species


Ginkgo Tree / Ginkgo Biloba

Lives in temperate and Mediterranean Climates.


Non-native species

N/a

Pollution source


Pollution / Greenhousise Gasose

EVERYWHERE - BUT YOU CAN HELP


Discussion Questions to address in your blog entry!
1. define and differentiate between ecology and environmental science and discuss the
Bellarmine campus in the context of both.! "

Ecology is about the science of animals and how they interact. It is at a biome level and includes information such as : where does the organism live? How does it cope in it's environment? What helps/harms the organism. Environmental science is focused on natural processes and it incorporates many different areas of the planet. An environmental scientist would be more focused on how the rain or the wind affects the organisms, while an ecologist might be more focused on how the organisms work together or fight for resources.

2. define and describe any population, community, ecosystem, biome and aquatic zone that you
find on campus; and discuss the biotic and abiotic factors that contribute to that ecosystem.! "

On campus myself and my peers found a variety of biomes. While the majority of the campus was covered in areas similar to grasslands and Mediterranean temperatures, there were some surprisingly swampy and colder areas. Some biotic factors that I noticed was the distinct lack of humidity. Another feature I noticed was fertile soil and mid-range temperatures going from 60-80 degrees throughout the time of observation in different areas.Some abiotic factors that I noted was a lack of insects.With all of the concrete and building, most of the insects were holed up and very difficult to find. Another abiotic factor that I witnessed was the dominance of birds in the area. This may have lead to the meager amount of worms and decomposer organisms that we were able to find.

3. construct and discuss a food chain, a food web, and an ecological pyramid based on the
trophic levels that you observe.! "

Food Chain =                                                  Food Web =


All of the chains are similar, with the human at the top and eating everything. The producer, the tree, is in the center supporting everyone. The spider is a major victim.


4. investigate and discuss any endangered, threatened, and invasive species on campus.! "

One of the endangered species that I was lucky to find was a Gingko tree, or a Ginkgo biloba. It is a very long lasting plant and has roots lasting all the way back to the Jurassic Period. 


5. define pollution, and describe and discuss the various types that you observe on campus.

Any item or organism that harms or affects the environment in a negative way is my definition of pollution. This could be classified as a disease, or a human brought change, such as trash or carbon dioxide poisoning. Most of the pollution that I saw was trash in gutters, holes, and even on the grass. I also saw smoke coming out of a building, which can also be classified as pollution. The sewage drains can also seep into the ground over time, causing pollution.


Monday, February 23, 2015

Corn Lab Report

Introduction


The lab that my group preformed last Friday was based on counting the phenotypes for corn. There were Mono Hybrid and Di-hybrid crosses, and we had to find the dominant and recessive alleles.

Mono Hybrid
Di-hybrid    


Purpose: The purpose of this lab was to find out how phenotypes work and how common the different alleles were in corn. 

Hypothesis: If there are more dominant genes in corn, then there will be less recessive genes left.

Materials: 2 Mono hybrid corn cobs, 1 Di hybrid corn cob. Ipad, and Mr. Wong

Procedures: 1. We were to first count the amount of each phenotype per corn, on the mono hybrid crosses.
2. After counting the corn and putting the data in, we counted the dihybrid crossed corn and put the data in too.
3. We then created a punnet square:

4. We then found out the phenotype ratios for each seed.
Purple and Smooth: 9/16
Purple and Shrunken: 3/16
Yellow and Smooth: 3/16
Yellow and Shrunken: 1/16
5. We then found the Chi Squared value for our corn. It was a good fit. 

Data 

MonoHybrid Cross:

Table 1 Number of Kernals    Kernal Percentage
Purple         206       81.1%
Yellow         48      18.9%
Total         254       100%


Table 2 Number of Kernals     Kernal Percentage
Smooth        166        77.8%
Shrunken        49       22.2%
Total        215       100%


Dyhibrid Cross


Table 3 Expected Number Observed Number [Observed - Expected]2/expected
Smooth & Purple Total; x 9/16 = 137.25                137 0.0046
Shrunken & Purple Total x 3/16 = 45.75                47 0.03410
Smooth & Yellow Total x 3/16 = 45.75                43 0.167350
Shrunken & Yellow Total x 1/16 = 15.25               17 0.20080
CHI SQUARE VALUE =============> 0.400728


Conclusions:

I can conclude that my hypothesis was correct, because there was a greater ratio of dominant genes than there were recessive. Our chi square value of 0.400 is very close to the good fit value of 0.58 This makes me believe that we had a good chi square fit. 

Analysis(Answers)\

1. The dominant phenotypes appear to be purple and smooth. 
2. The probable parents could be Pp and Pp because there is almost a 3 to 1 ratio of dominant to recessive genes.
3. The probable parents could also be Pp and Pp because again, there is almost a 3 to 1 ratio of dominant to recessive genes.
4. The expected percent is 75 purple to 25 yellow. 
5. My data is very close to what is expected, but falls short on the yellow.

PROBLEMS:
1. Problem:  A large ear of corn has a total of 433 grains, including 271 Purple & starchy, 73 Purple & sweet, 63 Yellow & starchy, and 26 Yellow & sweet.
Hypothesis: This ear of corn was produced by a dihybrid cross
(PpSs x PpSs) involving two pairs of heterozygous genes resulting in a theoretical (expected) ratio of 9:3:3:1.
Objective: Test Hypothesis using chi square and probability value.
 Total Kernals = 840    
 Expected                                        
 Purple and Smooth 9/16 of 433 = 243.6
Purple and Wrinkled 3/16 of 433 = 81.2
Yellow and Smooth 3/16 of 433 = 81.2
Yellow and Wrinkled 1/16 of 433 = 27.1

(Math using Calculator and paper)
3.08 + .82 + 4.07 + .04 = 8.01

This is a poor fit


2. Problem:  In a certain reptile, eyes can be either black or yellow. Two black eyed lizards are crossed, and the result is 72 black eyed lizards, and 28 yellow-eyed lizards.
Hypothesis: The black eyed parents were Bb x Bb.
Objective: Test your hypothesis using chi square analysis. In this set, because only two values (traits) are examined, the degrees of freedom (df) is

Expected
Punnet Square of Bb x Bb, I get an expected percentage of 25% and 75% or 1/4 and 3/4
Total number of lizards is 100 so the ratio works.
Expected ....................... Observed
Black Eyes = 75 ................ 72
Yellow Eyes = 25 ............. 28

.12 + .36 = .48
This is a good fit

3. Problem: A sample of mice (all from the same parents) shows
58 Black hair, black eyes 16 Black hair, red eyes
19 White hair, black eyes 7 White hair, red eyes

Your tentative hypothesis: (what are the parents?)

Objective: Use a chi square analysis to support your hypothesis:

 9/3/3/1 ratio, so the parents are HhEe x HhEe
Total number of offspring = 100
Expected
9/16 of 100 = 56.25
3/16 of 100 = 18.75
3/16 of 100 = 18.76
1/16 of 100 = 6.25
.05 + .40 + .003 + .09 = .54 = GOOD FIT


Monday, February 2, 2015

Meiosis the Movie Lab report


Synopsis: During the meiosis movie, the focus of the lab was to make a video showing the stages of meiosis 1 and 2. We used IMovie to edit our video. Here is a link of the assignment:
https://bcp.instructure.com/courses/1384/files/201663/download?wrap=1

youtube video: https://m.youtube.com/watch?feature=youtube_gdata_player&v=MCOlOMVeYrs


  • What is the function of meiosis?
There are many functions to mitosis, but one of the main functions is genetic diversity. People need to be different and adapt to avoid deadly illnesses, weaknesses, and to have an advantage over other organisms. Another function is to repair a damaged genetic line. For example, if Generation A was dying to a virus, Generation B or C could develop an immunity and let the species live longer.

  • What events promote genetic variation during meiosis?
One event that promotes genetic variation is crossing over during metaphase. The chromosomes share genetic material which gets passed on and changes genes. Mutation also causes genetic variation and changes the chromosomes. 
  • What causes non-disjunction?
Non-disjunction is the failure of separation of homologous chromosomes during cell division. This happens when going into anaphase, the chromosomes never split up. This can end up causing down syndrome and other harmful genetic disorders. Normally there is a checkpoint making sure that all of the chromosomes are in working order before going to the next stage, but failure of this system can cause non-disjunction.
  • Panda Bears have 42 chromosomes compared to the 74 chromosomes found in most bears. How could this occur? Explain in terms of non-disjunction.
This could have occurred because of a mutation, or because the Panda Bears require less genetic material. This could also mean that way back in the past, there was a massive checkpoint failure that allowed massive non-disjunction, leaving the bears with less chromosomes. Another explanation is that somewhere along the line there was a non-disjunction that actually improved the bears.

  • This lesson could be improved by including more about non-disjunction in the lesson. The response talks all about it, but it was barely mentioned in the actually activity.

Tuesday, January 20, 2015

Cancer Interview

I normally do not enjoy talking about illness and things that cause sufferings, but when I talked to anonymous I interviewed, it changed my perspective not only on cancer, but what it actually is. Anonymous was forty-three when she was diagnosed with breast cancer. She felt a lump, and was feeling pain and tiredness. She went to the doctor and in under two days she was diagnosed with a major tumor. Upon receiving this information, she was shocked and saddened to find that she had one of the most deadly and incurable illnesses in the world. She was immediately put through chemotherapy, which lasted seven months. During chemo, she felt extreme exhaustion, and spent most of her time sleeping. She also Lost all of her hair and had to wear a wig or hats in public. Near the end of chemo, she got sick easily and contracted colds, flues, and other ailments that were around. After she successfully completed chemo, she went through four months of radiation.  It caused her major rashes and her skin was severely damaged. She had to change her clothing style, and could not wear many things that she loved before. After cancer, her life changed for the better. She realized who loved her, cared about her, and how much her family meant to her. She told me that It made the family stronger in a sense. Having someone that close to being lost changes the way people see things in the world. She continued her old job, the one she had before she had cancer. After over a year in treatment, she was done. She told me that a common misconception is being lazy. She wanted dearly to move around and start working, even though she could barely walk. The motivation to do something was huge, but chemo was so devastating. A few recommendations she had for everyone  was to go along with cancer screening, and identify any symptoms as quickly as possible, and importantly, hang on to the things you love.


Breast cancer effects the breasts, and it is most common in women. It effects the inner cells, forming a tumor that feels like a bruise from the outside. Once the tumor is created, it starts to spread throughout the body spreading pain and killing the normal cells and tissues. It effects the ability to produce milk, the ducts carrying it, and the fatty tissue surrounding it. There is no sure cause of breast cancer, but one fact is that it is caused from mutation in a cell that reproduces faster than normal cells. It can be genetic or random, and no one is immune. Since cancer is random, there is no sure way to stop people from getting it. There are a few theories as to what can prevent it, such as breastfeeding, exercising, reducing alcohol, and other generally healthy activities. There are many ways to treat cancer. This includes surgery(removing the tumor),  Radiation(Killing it with X-rays), and Chemotherapy(Cancer-killing Drugs.). There are other ways to remove cancer but breast cancer generally uses these three. In 2014, twelve percent of all females were found with invasive breast cancer. This is a massive part of the population. Because there are 160,000,000 women in America, there are 182,000 people with breast cancer(Approximately). Breast cancer is most common in the United States and UK, but generally only hits people before they are fifty years old.


REFERENCES:
http://www.cancer.org/cancer/breastcancer/detailedguide/breast-cancer-what-causes
http://www.cancer.org/cancer/breastcancer/detailedguide/breast-cancer-what-is-breast-cancer
http://www.mayoclinic.org/healthy-living/womens-health/in-depth/breast-cancer-prevention/art-20044676
http://www.cancer.org/cancer/breastcancer/detailedguide/breast-cancer-treating-general-info
http://www.breastcancer.org/symptoms/understand_bc/statistics
http://emedicine.medscape.com/article/1697353-overview#aw2aab6b3

Tuesday, January 13, 2015

Mitosis Lab Report

INTRODUCTION AND PROCEDURES

Purpose of this Lab: The purpose of the Mitosis lab was to find the different cells in their stages of mitosis and determine the amount of interphase, prophase, metaphase, anaphase, and telophase cells.

Hypothesis: There will be more interphase and prophase than metaphase and anaphase. This is because they are the two longest stages of mitosis.

Procedure: In the Mitosis lab, I worked with my partner Mike to take pictures of cells so we could analyze the data and find results. This started with getting an onion root tip on a tray, and then looking at it through different magnifications. We started with the 10x magnification, but since that was very difficult to see: 

we decided to move to a higher resolution. We chose to move up to 40x:


 This was perfect for us because it not only provided a lot of different cells, it was close enough to tell the stages. From there, we got many different segments of the onion root until we had many pictures of cells. 


RESULTS


This was my table of results. This shows that the approximate time spent in each stage is very similar to the percent of total cells counted. Here are some photos of the cells I took:


This is a pie chart I created showing the percent of each stage from my data.

ANALYSIS AND CONCLUSIONS

After reviewing the data, it shows that the time spent in Mitosis is very similar to the percent of cells in that stage. This means that the more time a cell spends in that stage, the more likely you are to find it there.
My hypothesis was proven because the prophase and interphase cells were found the most. This shows that they also spend the longest time in there.
Questions:
1. Why is it more accurate to call mitosis "nuclear replication" rather than "cellular division"?
Nuclear replication is more accurate because the cell is replicating its DNA, instead of just dividing itself. It is creating a literal copy of itself to go and create more copies. 
2. Explain why the onion root tip is selected for a study of mitosis.
The onion root tip was chosen because the chromosomes are very large and dark when stained. They are easy to find and does not damage the root tip in the process.

1. If your observations had not been restricted to the area of the root tip that is actively dividing, how would your results have been any different?
My results would have changed dramatically because if I took pictures over time, the cells would change stages. This would result in minor data changes, and definite proof of the time that cells spend in each stage.
2. Based on the data in the table, what can you infer about the relative length of time an onion root-tip cell spends in each stage of cell division?
Based on the data, I showed in the pie chart the percent of each stage I found. I infer that the time spent in each stage would be similar to the percent of cell stages I found. 


Tuesday, December 2, 2014

Up Up and Away Blog Lab Report

UP UP AND AWAY

A group lab report by Mason, Abhinov, Mike, and Joel

Materials Used:
Glass Stirring Rod
Two 500 Ml containers
Baking Soda
Distilled Water
Liquid Dish washing Detergent.
Leaves from Hedera or Spinacia families    
Aluminum Foil
Stopwatch
Camera
2 clear plastic cups
Hole Puncher
Syringe

Procedure:
  1. Make a sodium bicarbonate solution in a beaker by combining the baking soda with the distilled water, then mix
  2. Add detergent, and stir gently
  3. Use a hole puncher to make 60 leaf disks.
  4. Make a vacuum in the syringe with 30 of the leaf disks.
  5. Put this in a clear cup with the solution, covered in foil
  6. Repeat step 4 and 5 but with the cup in the light.
  7. Set a stopwatch for 21 minutes and count how many disks rise every minute.

Hypothesis: If the leaf disks are left in the water for a longer amount of time, more leaves will experience photosynthesis and raise to the top.

Purpose: The purpose of this lab was to learn about photosynthesis and how is is triggered. The light and water in the experiment along with the solution sped up the process and demonstrated how it worked. 

Results and Data:

Line graph of the Data we found during the Lab. It seems like the dark treatment barely had any photosynthetic reactions while the light reaction cup was steadily rising for 21 minutes.


This is a video of two leaf disks rising under the light cup.


Picture of the leaf disks rising in the light cup.
Graph of our original Data.


Analysis: Our results showed that my hypothesis was correct, the longer the disks are in the water with light, the more photosynthesis will go on. As the line graph showed, there was a steady raise of 1 or 2 disks per minute. The disks rise slowly, as shown in the video. This means that the photosynthesis reaction happens slowly or the density of the leaves are slowly lowered. Our light reaction seemed to work out well, while our dark reaction had a few issues. This could meant that photosynthesis is impossible without light, or there was scientific error on our end.

Conclusion: Our photosynthesis experiment was successful and we learned a lot. We concluded that the rate of photosynthesis depends on the amount of light being received. The more light, the faster the leaves rose.


Wednesday, November 19, 2014

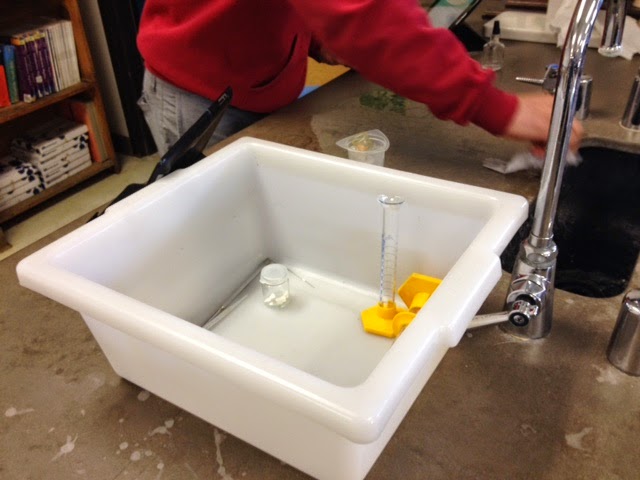
In this lab activity, we tried to find out how much oxygen would come out of the catalyst reaction. My hypothesis is that the more enzyme we put in the hydrogen peroxide, the more oxygen will be produced. The procedure began with us getting a test tube and putting varying amounts of enzyme in the tube. Then we put it underwater and measured how much oxygen comes out using a second test tube.


Picture of the enzymes in the tube.                  

Picture of the water we used.                          

Picture of the enzymes getting ready for use.

Picture of the completed reaction chamber.   

Start of the lab with all of the materials.        

Table with our Data.                                  


My hypothesis was proved because more oxygen was leaked with four enzymes than when we had one enzyme. We did this lab to explain enzymes and how they work with the environment. I learned that reactions can be sped up by adding more enzymes.